
Construction Progress Tracking with Computer Vision
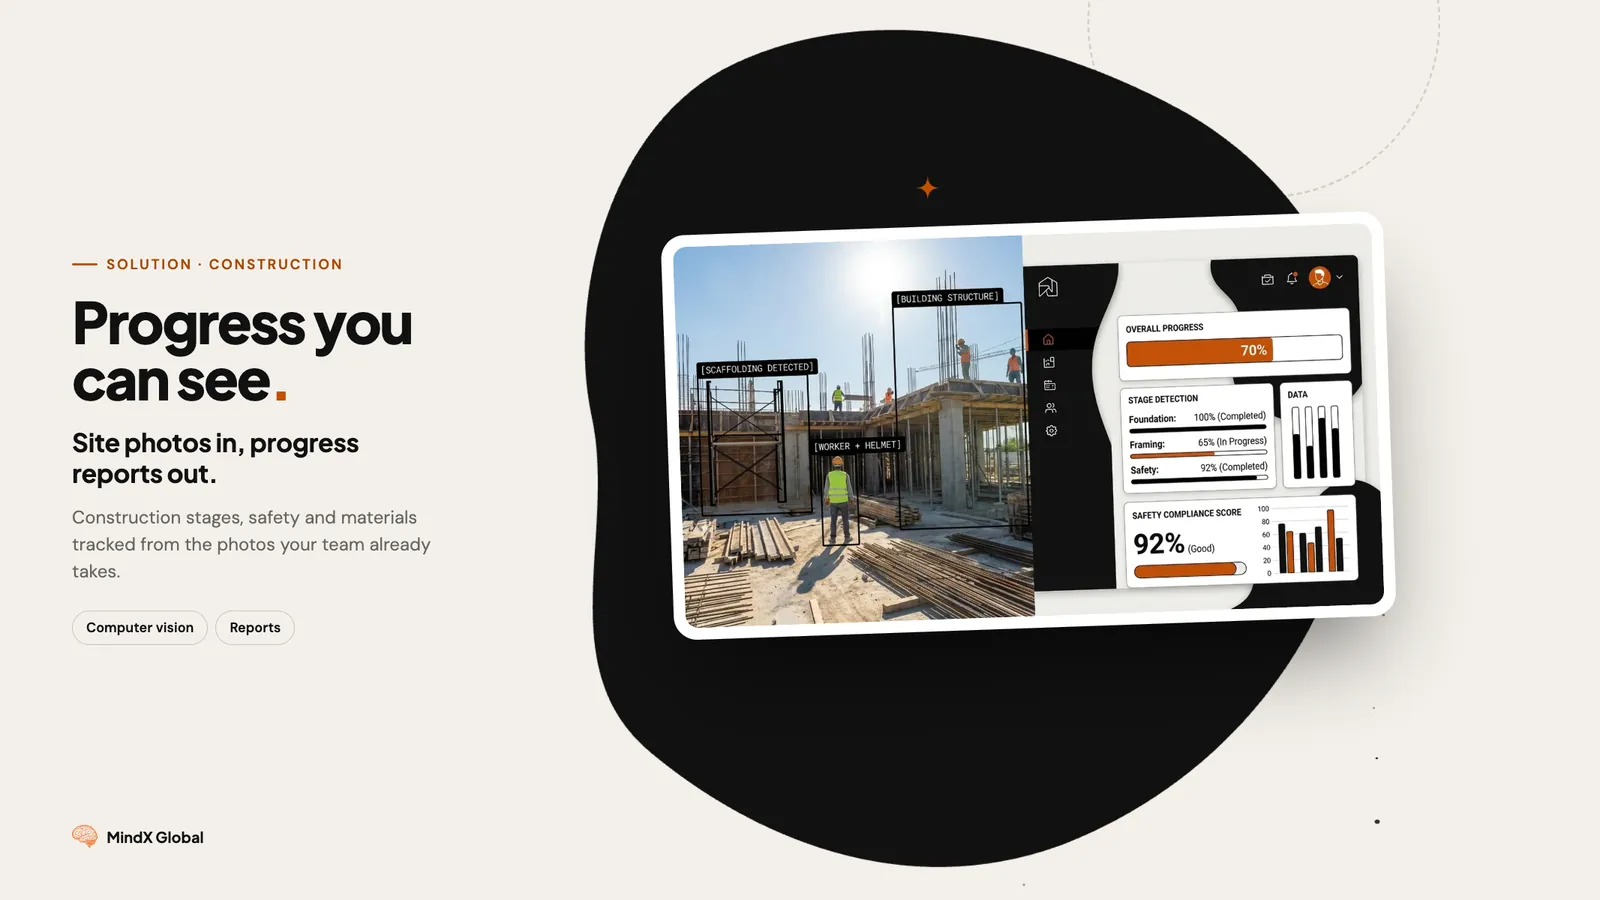
Your site managers already take the photos. We turn them into a structured progress report — stage by stage, trade by trade — without anyone writing it up.
- Construction stage detected from ordinary site photos
- Safety and PPE compliance scored on every visit
- Structured data out, not another PDF nobody opens
- Projects delivered
- 50+Projects delivered
- Report lag removed
- 2-3 daysReport lag removed
- No special cameras
- Any phoneNo special cameras
- Reply from the engineer
- 24hReply from the engineer
What is computer vision progress tracking?
Computer vision progress tracking is software that looks at photographs of a building site and works out what has actually been done. It reads the stage each area has reached, what materials are on site, and whether people are wearing the right protective equipment — then writes that into a report as data rather than prose.
The photos already exist. A site manager walking a job takes fifty to a hundred a day on their phone. What does not exist is the time to turn them into something a head office can compare week to week. So the photos sit in a camera roll and the report gets written from memory, two or three days late, with estimates like "framing is about sixty or seventy per cent".
The difference matters when you run more than one site. Two managers looking at the same wall will give you two different numbers, and neither is wrong exactly — they are just judging by eye. A model judges the same way every time, which is what makes the weeks comparable.
It is worth being clear about the limits. A photograph carries what is visible, and nothing else. Structural progress shows up plainly because it changes the shape of the building; second-fix work behind a closed wall does not, and no amount of modelling will recover it. The useful question is not whether a camera can see everything, but how much of your weekly reporting is already being judged by eye from photographs — because that part can be done consistently, and the rest still needs a person.
How it works
- 1
Capture
Site staff photograph the job the way they already do. Any phone, no fixed cameras, no app to learn.
- 2
Detect
The model identifies the construction stage in each area, the materials present, and the equipment in frame.
- 3
Score
Safety and PPE compliance are scored per photo, and anything the model is unsure about gets flagged for a person.
- 4
Report
Everything lands as structured data — into your dashboard, your spreadsheet, or straight into the tools you already run.
What gets pulled out of a photo
| Field | Example | Confidence |
|---|---|---|
| Construction stage | Framing — 60% complete | 0.94 |
| Materials on site | Rebar, formwork, scaffold | 0.91 |
| PPE compliance | 4 of 5 workers in hard hats | 0.88 |
| Trade active | Electrical first fix | 0.86 |
| Access and egress | Route clear, edge protection present | 0.83 |
| Change since last visit | Slab poured, formwork struck | 0.90 |
We have built this
We built a progress tracker that reads daily site photographs, works out the construction stage, scores safety compliance and produces structured reports without anyone writing them up. The case study covers how stage detection was trained, what it got wrong in the first weeks, and why confidence flagging — sending anything uncertain to a person rather than guessing — turned out to matter more than raw accuracy. It also covers what we could not make work from photographs alone, which is the part most write-ups leave out.
Read the full case study →Manual walkthroughs vs generic AI vs purpose-built
| Manual write-up | Generic image AI | Purpose-built | |
|---|---|---|---|
| Time per site | 2-3 hours | Minutes | Seconds |
| Stage judgement | Human, varies by person | None — describes the picture | Trained on construction stages |
| Safety scoring | If someone remembers | Not reliably | Every photo, every visit |
| Comparable week to week | Rarely | No | Yes, same judgement every time |
| Output | Prose in a PDF | A caption | Structured data you can chart |
Sends data to: Procore · Autodesk Construction Cloud · PlanGrid · Power BI · CSV · REST API
Frequently asked questions
How accurate is photo-based progress detection?
It depends on the trade and how visible the work is. Structural stages — excavation, foundations, framing, cladding — read reliably because they change the shape of the building. Finishing work behind a wall does not, and no camera will tell you otherwise. We measure accuracy against your own current process on a sample of your photos before you commit to anything, so you get a real number for your sites rather than ours.
Do we need special cameras or fixed installations?
No. The system is built around the photographs your team already takes on their phones. Fixed cameras give you more frequent coverage if you want it, and we can work with those too, but they are not a requirement to start.
What about weather, poor light and bad angles?
Those are the normal case on a building site, not the exception, so the model is trained on them. What matters more is that anything it is unsure about is flagged rather than guessed — a low-confidence reading goes to a person instead of quietly entering the report as fact.
Can it tell the difference between two similar stages?
Between neighbouring stages, usually. Between stages that look identical from outside, no — and we would rather say so. Where the visual difference is genuinely absent, the honest answer is that the photo cannot carry the information, and we will tell you that during the assessment rather than after you have bought something.
How does it fit with Procore or Autodesk?
The output is structured data, so it goes wherever your reporting already lives. We push into Procore and Autodesk Construction Cloud, write to a spreadsheet, or hand you a REST endpoint and let your team wire it up. We do not ask you to move off the tools you run.
What does it cost and how long does it take?
Both depend on how many sites you run and how much of the reporting you want automated. Every project starts with a free assessment: send us a sample of your site photos and we will tell you what can be read from them, how accurately, and what the reporting time saved is worth. You will get that back within 24 hours, from the engineer who would build it.
Who actually reads the output — site or head office?
Both, but they want different things. Site teams want the exceptions: what slipped, what is blocked, what needs a hard hat conversation this morning. Head office wants the series: the same measure, week after week, across every job, so a slipping programme is visible before it becomes a claim. Because the output is structured data rather than prose, the same run feeds both without anyone re-keying it.
What happens to photographs of workers?
PPE scoring needs to see people, so faces appear in the source images. We treat that as a data protection question rather than a technical detail: the images stay in your tenancy, the model returns counts and compliance flags rather than identities, and we can blur faces on ingest where your works council or GDPR assessment requires it. That gets agreed before any photographs move, not after.
Can we trial it on a single site first?
That is the normal way in, and we would push back on anyone who wanted to start wider. One job, a few weeks of photographs you have already taken, measured against the reports your team wrote by hand for the same period. If the numbers do not hold up on your own sites, you have lost a fortnight and no money.
What manual progress reporting is costing you
See what manual data entry is costing you
Rough estimate at ~90% automation over 220 working days a year. Your exact numbers come from the free assessment.
Get a Free Assessment
Send us a few of your documents and we'll tell you exactly what can be read from them, how accurately, and how much time it would save. No commitment.
See what manual data entry is costing you
Rough estimate at ~90% automation over 220 working days a year. Your exact numbers come from the free assessment.
Prefer to talk live? Book a call directly.
No preparation needed · Get actionable insights · Zero obligation


